Seite wird geladen ...

QSG 5500A/2910A 04.21m
Quick Start Guide
KiDAQ Data Acquisition
Type 5500A
KiStudio Lab
Type 2910A
Foreword
Thank you for choosing a Kistler quality product. Please read
these instructions carefully to get ready for your first measure-
ments.
The information in this document is subject to change at any time
without prior notice. Kistler reserves the right to improve and
modify the product in accordance with technical progress without
the obligation to inform persons and organizations based on
these changes.
© 2018…2021 Kistler Group. All rights reserved.
Content
1. General Information
2. Software and Firmware Download
3. Device Description
4. Connect device and install KiStudio Lab
5. Setting up a Simple Measurement
6. Export for Post Processing
1 General Information
KiDAQ is a modular data acquisition system that is flexible and
can be extended with additional measurement modules and
devices.
The intuitive KiStudio Lab software is used to configure and oper-
ate the KiDAQ device as well other Kistler data acquisition devic-
es like LabAmp. The software will be installed on your PC.
System requirements and recommendations:
1. Windows 10 Professional, 64 Bit version 1803 (Build 17134)
or newer, with Hyper-V. (Windows 7 and older versions are
not supported.)
2. Intel Core i7-7500, 2.7 GHz or better (recommended)
3. 16 GB RAM (minimum)
4. SSD (recommended)
> 110 GB free disk space on system partition (minimum)
5. Spare USB interface for USB-to-Gigabit-Ethernet adapter
6. Display resolution 1920 x 1080 / full HD (recommended)
The data export in binary MDF format enables the easy further
processing of the acquired signals in analysis software jBEAM.
This Quick Start Guide is intended for quick commissioning of the
instrument. Further information can be found in the KiDAQ and
KiStudio Lab manual.
2 Software and Firmware Download
The latest KiStudio Lab software version can be downloaded from
the Kistler website:
https://www.kistler.com/en/product/type-2910a/
The download file includes also further documentation like the
KiDAQ and KiStudio Lab manual and product datasheets.
The measurement devices are delivered with the most current
firmware already installed. In case you need to update the firm-
ware, you can find the files on the corresponding product page on
the Kistler website:
KiDAQ Controller Type 5551A:
https://www.kistler.com/en/product/type-5551a/
LabAmp Type 5165A:
https://www.kistler.com/en/product/type-5165a/
LabAmp Type 5167A:
https://www.kistler.com/en/product/type-5167ax0/
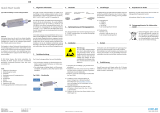
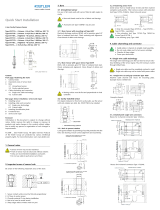
3 KiDAQ Device Description
The following picture shows the basic elements of the KiDAQ
data acquisition system and refers to the corresponding letters
with further descriptions.
KiDAQ Portable – Controller 5551A and Modules 55xxA
Description
Connector for 24 V power supply
(e.g. plug-in power supply unit)
Inputs for digital signals
USB-Ports (2x USB 2.0, Type A)
Ethernet interfaces (RJ45) for connection to a network
or directly to a computer
Sensor inputs (for example 5509A):
- BNC neg.
- LEDs per input channel (module 5509A only)
LEDs which signify the status of the corresponding
measuring module
Status LEDs
Following table depicts the possible states of the KiDAQ controller
and measurement module status LEDs in normal operation. For a
signaling not in this list, please consult the KiDAQ manual.
LED Status
Operating Status
KiDAQ Controller 5551A
A
Blue illuminated
Normal operation
B
Off
KiDAQ Measurement Modules 5501A to 5535A
A
Blue illuminated
Module status:
normal operation (measuring)
B
Green illuminated
Data transfer to controller in
progress (normal operation)
Green flashing
Module configuration mode
C
Green illuminated
All inputs are in the configured
measuring range
Red illuminated
Input overflow
(e.g. due to open input)
KiDAQ Charge Module 5509A Channels
Ch.
1
2
3
4
Blue illuminated
Charge amplifier is in
‘Measure’ mode
Blue flashing
Charge amplifier is in
‘Reset’ mode
Red illuminated
Charge input is (or was) in
overload
4 Connect device and install KiStudio Lab
4.1 Connect the device to the PC
Ethernet is used as a connection from your computer to the
KiDAQ measurement device. Please plug-in the delivered USB-
to-Ethernet adapter prior installation. (The physical Ethernet port
remains free for other applications).
4.2 Install the KiStudio Lab Software
Unzip all files from the download file and start the .msi-installation
with administrator rights. This installation process installs a virtual
machine on your computer in which the KiStudio Lab software will
run.
Note: Please make sure no other networks with subnet
192.168.103.0 (mask 255.255.255.0) are in use.
4.3 Finding the device in the network
The device will be detected automatically at the according setup
step (see below).
Please note: The first start of the app takes up to 5 minutes and
therefore longer than usual.
5 Setting-up a Simple Measurement
After starting the KiStudio Lab software, follow the steps on the
screen. When starting the software on your PC for the first time,
you will be asked to name and create your first project.
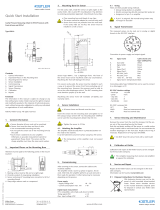
You will then be guided to the Project Board overview window
(see screenshot below).
The logic behind this overview window is that you work your way
from left to right to configure your system and get your first signal
in less than five minutes. For a quick configuration only the three
columns Project Devices, Measurement Setup and Dashboard
Definition are needed.
The first step is to add the connected data acquisition
device to your project and configure it according your
measurement task:
1. In the column Project Devices add the connected
measurement device to your previously created
project (the device will be detected automatically).
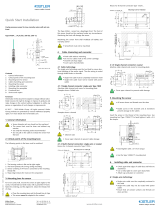
2. You will now be taken to the Measurement Setup
page - you are at device level. Your added meas-
urement device is shown schematically in the figure
below. To the left of the diagram, you can switch
from the device level to the controller level or the
respective measurement module level to change
settings.
3. After you have configured all settings, you must
write them to the device (indicated by the yellow
settings fields). Via the button Write Settings you
can write the settings from the software to the de-
vice.
4. In the tab Dashboard Definition, you have the pos-
sibility to select your favored graphs of the meas-
ured signal.
5. You can make further settings by clicking on the
desired dashboard element. You can save these
settings by clicking Save and back. Now you have
the possibility to change the size and position of the
dashboard or to add further dashboard elements.
6. By clicking on the button Live View, the desired
dashboard is activated, and the signals are visual-
ized.
Please note: In this mode, no data is recorded, only
displayed. Data recording is initiated via Start Recording
or if a trigger is defined and armed and the trigger
condition is fulfilled.
6 Export for Post Processing
Recorded measurements are listed under Recordings and can be
exported easily for further analysis and post-processing with
jBEAM (see separate Quick Start Guide).
A
B
C
D
E
F
Measurement chain configuration from left to right

QSG 5500A/2910A 04.21m
Schnellanleitung
KiDAQ Datenerfassung
Typ 5500A
KiStudio Lab
Typ 2910A
Vorwort
Wir danken Ihnen, dass Sie sich für ein Kistler Qualitätsprodukt
entschieden haben. Bitte lesen Sie diese Anleitung sorgfältig
durch, um sich für die erste Messung bereit zu machen.
Die Angaben in diesem Dokument können jederzeit ohne Voran-
kündigung geändert werden. Kistler behält sich das Recht vor,
das Produkt im Sinne des technischen Fortschritts zu verbessern
und zu ändern, ohne Verpflichtung, Personen und Organisationen
aufgrund solcher Änderungen zu benachrichtigen.
© 2018…2021 Kistler Group. Alle Rechte bleiben vorbehalten.
Inhaltsverzeichnis
1. Allgemeine Informationen
2. Software- und Firmware-Download
3. KiDAQ Gerätebeschreibung
4. Gerät verbinden und KiStudio Lab installieren
5. Die erste Messung mit KiStudio Lab
6. Datenexport für weitere Verarbeitung
1 Allgemeine Informationen
KiDAQ ist ein modulares Datenerfassungssystem, welches flexi-
bel um weitere Messmodule und Messgeräte erweitert werden
kann. Die Konfiguration sowie Bedienung des Datenerfassungs-
geräts erfolgt über die intuitive KiStudio Lab Software. Die Soft-
ware wird auf Ihrem PC installiert.
Systemanforderungen und -empfehlungen:
1. Windows 10 Professional, 64 Bit Version 1803 (Build 17134)
oder neuer mit Hyper-V. (Windows 7 und älter wird nicht un-
terstützt).
2. Intel Core i7-7500, 2.7 GHz oder besser (empfohlen)
3. 16 GB RAM (minimum)
4. SSD (empfohlen)
> 110 GB freier Speicherplatz auf der Systempartition (mini-
mum)
5. Freie USB-Schnittstelle für USB-zu-Gigabit-Ethernet Adapter
6. Monitorauflösung 1920 x 1080 / full HD (empfohlen)
Der Daten-Export ins binäre Format MDF ermöglicht die einfache
Weiterverarbeitung der erfassten Signale in der Analyse-Software
jBEAM.
Die vorliegende Schnellanleitung dient zur schnellen Inbetrieb-
nahme des Geräts. Weiterführende Informationen finden Sie im
KiDAQ und KiStudio Lab Betriebshandbuch (Manual).
2 Software and Firmware Download
Die neueste Version der KiStudio Lab Software kann von der
Kistler Webseite heruntergeladen werden:
https://www.kistler.com/de/produkt/type-2910a/
Die Datei mit den Installationsdateien beinhaltet auch weitere
Informationen wie die Betriebsanleitung (Manual) und Datenblät-
ter.
Die Messgeräte werden jeweils mit der aktuellen Firmware aus-
geliefert. Falls eine Firmware-Aktualisierung erforderlich ist, fin-
den Sie die entsprechenden Firmware-Dateien ebenfalls auf der
Kistler Webseite.
KiDAQ Controller Typ 5551A:
https://www.kistler.com/de/product/type-5551a/
LabAmp Typ 5165A:
https://www.kistler.com/de/product/type-5165a/
LabAmp Typ 5167A:
https://www.kistler.com/de/product/type-5167ax0/
3 KiDAQ Gerätebeschreibung
Das folgende Bild zeigt die wesentlichen Elemente des KiDAQ
Datenerfassungssystems und verweist auf die entsprechenden
Buchstaben mit weiterführenden Beschreibungen.
KiDAQ Portable – Controller 5551A und Module 55xxA
Beschreibung
Anschluss der 24 V Spannungsversorgung
(z.B. Steckernetzteil)
Eingang für digitale Signale
USB-Anschlüsse (2x USB 2.0, Typ A)
Ethernet-Schnittstellen (RJ45) für die Anbindung an
ein Netzwerk oder direkt an einen Computer
Sensoreingänge (am Beispiel 5509A):
- BNC neg.
- Leuchtdioden pro Eingangskanal (nur Modul 5509A)
Leuchtdioden (LEDs), welche den Status des entspre-
chenden Messmoduls signalisieren
Status LEDs
Folgende Tabelle zeigt die möglichen Zustände der KiDAQ Con-
troller und Messmodul Status-LEDs in normalem Betrieb. Weitere
Signalisierungen sind im KiDAQ Manual ersichtlich.
LED -Status
Betriebsstatus
KiDAQ Controller 5551A
A
Blau leuchtend
Normaler Betrieb
B
Aus
KiDAQ Messmodule 5501A bis 5535A
A
Blau leuchtend
Modul Status:
Normaler Betrieb (messend)
B
Grün leuchtend
Datentransfer zum Controller läuft
(normaler Betrieb)
Grün blinkend
Modul-Konfiguration läuft
C
Grün leuchtend
Alle Eingänge sind im konfigurier-
ten Eingangsbereich
Rot leuchtend
Messbereich überschritten
(z.B. durch offenen Eingang)
KiDAQ Ladungsmodul 5509A Kanäle
Ch.
1
2
3
4
Blau leuchtend
Ladungsverstärker ist im Mess-
modus
Blau blinkend
Ladungsverstärker ist im Reset-
modus
Rot leuchtend
Ladungsverstärkereingang ist
(oder war) in Überlast
4 Gerät verbinden und KiStudio Lab installieren
4.1 Geräte mit dem PC verbinden
Verbinden Sie vor der Installation der KiStudio Lab Software das
KiDAQ System mit dem PC. Die Verbindung des Messdatener-
fassungsgeräts erfolgt über eine Ethernet-Schnittstelle. Verwen-
den Sie dazu nur den beigelegten USB-zu-Ethernet-Adapter.
Damit haben Sie ihre bestehende Netzwerkschnittstelle frei für
andere Anwendungen.
4.2 Installation der KiStudio Lab Software
Entpacken Sie allen Dateien aus der ZIP-Datei und starten Sie
die .msi-Datei mit Administratorrechten. Bei diesem Installations-
prozess wird eine virtuelle Maschine auf Ihrem Rechner installiert,
in welcher die KiStudio Lab Software anschließend läuft.
Hinweis: Stellen Sie sicher, dass keine anderen Netze mit Sub-
netz 192.168.103.0 (Maske 255.255.255.0) verwendet werden.
4.3 Auffinden des Geräts im Netzwerk
Das Gerät wird beim entsprechenden Einrichtungsschritt automa-
tisch erkannt (siehe unten).
Bitte beachten Sie: Der erste Start der Software kann bis zu 5
Minuten dauern und somit länger als gewöhnlich.
5 Die erste Messung mit KiStudio Lab
Folgen Sie nach dem Start der KiStudio Lab App den Schritten
auf dem Bildschirm. Beim ersten Start der Software werden Sie
darum gebeten Ihr erstes Projekt zu benennen und zu erstellen.
Anschließend gelangen Sie in das Übersichtsfenster Projektüber-
sicht (siehe nachfolgender Screenshot).
Die Logik hinter diesem Übersichtsfenster ist, dass Sie sich von
links nach rechts durcharbeiten, um das System zu konfigurieren
und in weniger als fünf Minuten zum ersten Graph zu gelangen.
Für eine schnelle Konfiguration werden nur die drei Spalten
Messgeräte, Messsetup und Dashboard Definition benötigt.
Im ersten Schritt müssen Sie das angeschlossene
Messdatenerfassungsgerät Ihrem Projekt hinzufügen
und der Messaufgabe einstellen:
1. Fügen Sie in der Spalte Messgeräte im Projekt das
angeschlossene KiDAQ System Ihrem zuvor erstell-
ten Projekt hinzu (das Gerät wird automatisch er-
kannt).
2. Nun gelangen Sie auf die Konfigurationsseite des
Systems – Sie befinden auf der Geräteebene. Ihr
hinzugefügtes Messsystem wird schematisch abge-
bildet. Links im Menu können Sie von der Geräte-
ebene auf die Controllerebene bzw. in die jeweilige
Messmodulebene wechseln, um dort Einstellungen
vorzunehmen.
3. Nachdem Sie alle Einstellungen gesetzt haben,
müssen Sie diese auf das Gerät schreiben (dies
wird Ihnen durch gelbe Einstellungsfelder signali-
siert). Über den Knopf Einstellungen schreiben kön-
nen Sie die Einstellungen von der Software in das
Gerät schreiben.
4. In der Spalte Dashboard Definition haben Sie die
Möglichkeit Ihre gewünschten Graphen für die
gemessenen Signale zu wählen.
5. Durch Klick auf das gewünschte Dashboard-
Element können Sie weitere Einstellungen vor-
nehmen. Diese können Sie durch Speichern und
zurück bestätigen. Nun haben Sie die Möglichkeit
Grösse und Position der Dashboard-Elemente zu
verändern oder weitere Elemente hinzuzufügen.
6. Durch Klicken auf den Knopf Live Ansicht wird
das konfigurierte Dashboard aktiviert und sie er-
halten ein Livebild der Signale.
Bitte beachten Sie: In diesem Modus werden
keine Daten aufgezeichnet, sondern lediglich ange-
zeigt. Die Datenaufzeichnung erfolgt über Aufzeich-
nung starten oder wenn ein Trigger definiert und
aktiviert ist und die Trigger-Bedingung erfüllt ist.
6 Datenexport für weitere Verarbeitung
Aufgezeichnete Messungen werden unter Aufzeichnungen aufge-
listet und können einfach exportiert werden für die Analyse und
Nachbearbeitung mit jBEAM (siehe separate Schnellanleitung).
A
B
C
D
E
F
Messkette von links nach rechts konfigurieren
1/2